Your dashboard
Your dashboard is the home screen you land on every time you sign in. It gives you a live, at-a-glance picture of where your bookkeeping stands for the quarter, so you can see what is done, what still needs attention, and jump straight to the next task.
Picking your business and quarter
Everything you see on the dashboard, and on every other page, is filtered by two choices at the top of the sidebar:
- Your business. If you keep books for more than one company, use the business selector to switch between them. Each business has its own transactions, receipts, mileage and figures.
- The quarter. Pick the fiscal quarter (Q1 to Q4) and year you want to work on. In the Dutch quarterly rhythm that means Q1 (January to March), Q2 (April to June), Q3 (July to September) and Q4 (October to December).
Your choices stay put as you move around. Once you pick, say, "Q1 2026", every page you open shows Q1 2026 until you change it again. There is nothing to re-select page by page.
Tip: When a new quarter starts, switch the quarter selector first. That way every total, chart and list you look at is for the right period from the moment you sit down.
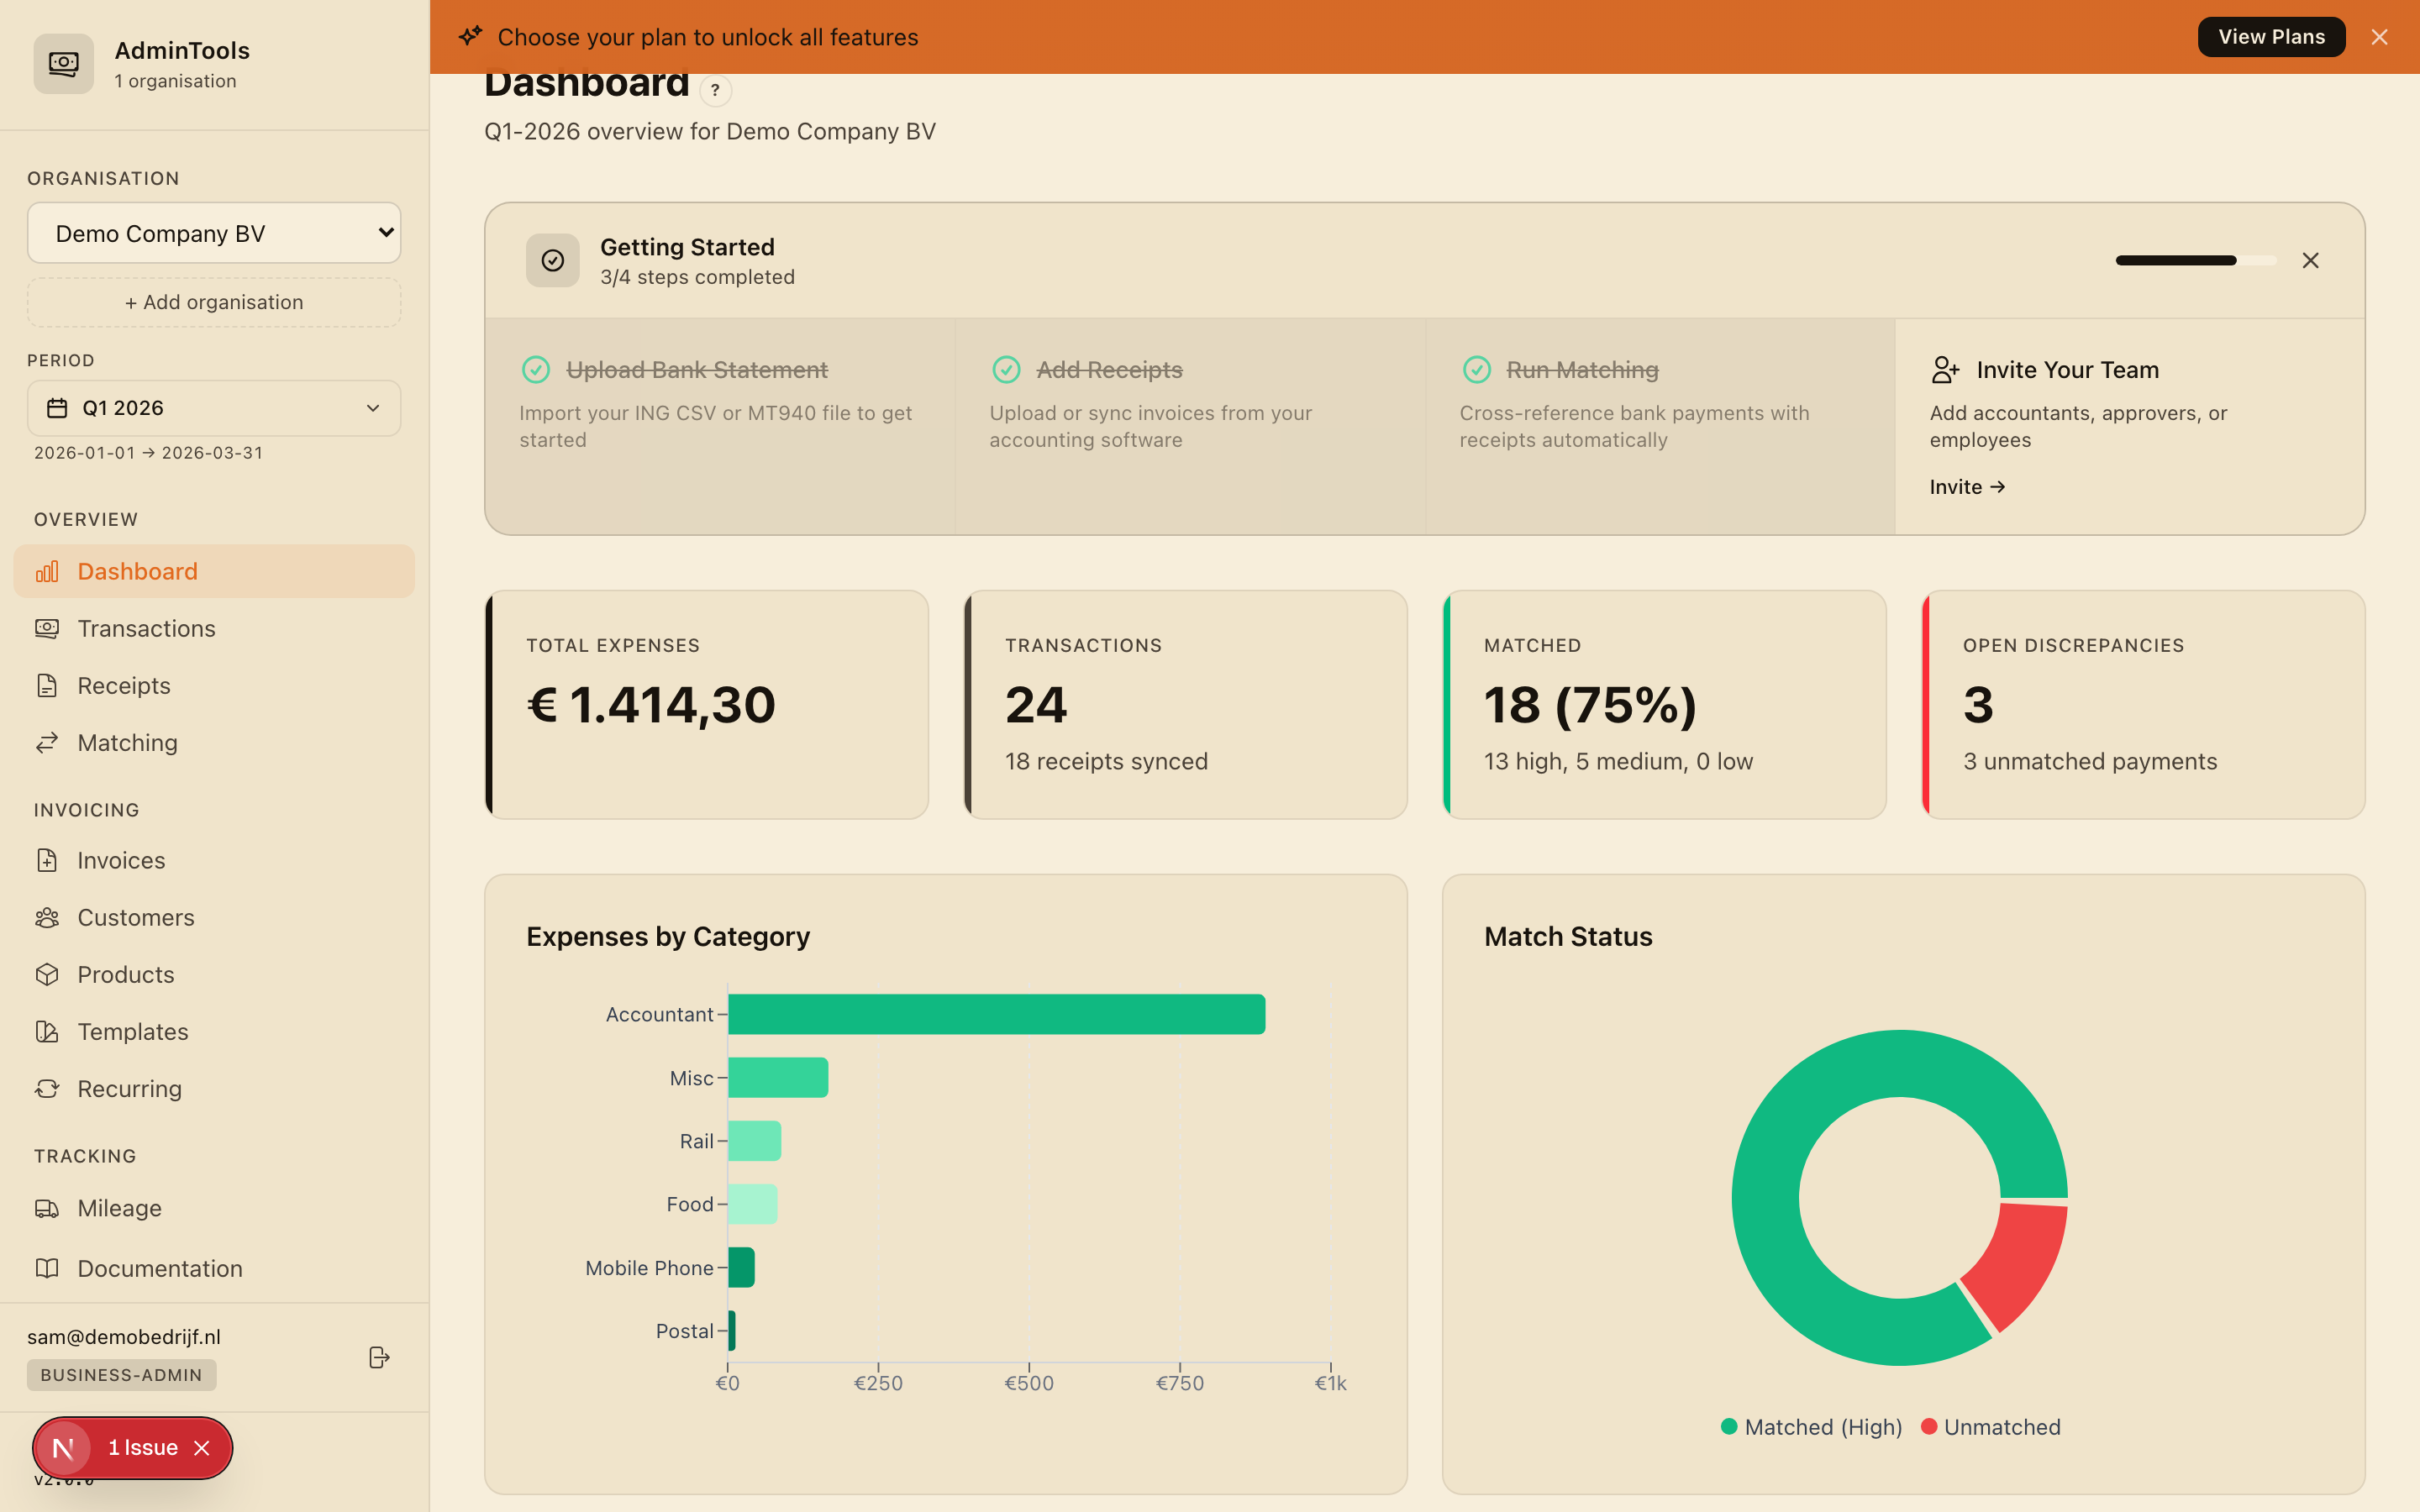
The four KPI cards
Across the top of the dashboard you will see four cards. They are your quick health check for the quarter.
Total expenses
The sum of all your matched business expenses for the selected quarter. It also shows how this quarter compares with the one before, so you can spot at a glance whether your spending is up or down.
Match status
How many of your bank transactions are reconciled. A progress ring shows matched versus unmatched at a glance. When the ring is full, you have linked every transaction to a receipt or invoice and your reconciliation for the quarter is complete.
Reimbursements owed
The running balance your company owes you (or a team member) for expenses paid out of a personal account. If the figure is above zero, there is money still to be paid back.
Mileage total
The total business kilometres logged for the quarter, alongside the euro amount calculated at the Dutch tax-free rate of €0.23/km. This is the figure that flows into your quarterly mileage claim.
Charts: see the shape of your quarter
Below the cards, a set of charts turns your numbers into a picture you can read in seconds.
- Spend by category. A horizontal bar chart breaking your spending down by category, such as Food, Accountant, Mobile, Hardware and Subscriptions. The categories line up with the columns in your quarterly export, so what you see here is what your accountant will see.
- Monthly trend. A stacked bar chart covering the three months of the chosen quarter, broken down by category. It is the quickest way to spot a spike or an unusual month.
- Match status. A breakdown of your transactions into three groups: matched (linked to a receipt or invoice), needs review (a suggested match waiting for you to confirm) and unmatched (no receipt or invoice found yet). It tells you exactly how much reconciling is left.
- Top suppliers. Your biggest suppliers by total spend for the quarter, so you can see where most of your money is going.
Quick actions
At the bottom of the dashboard you will find buttons for the jobs you do most often, so you never have to go hunting through menus. From here you can:
- Import a bank statement
- Sync purchase invoices from your accounting software
- Run matching to reconcile transactions against receipts
- Download your quarterly spreadsheet for the accountant
These are shortcuts to the same features in the sidebar, gathered in one place for the natural flow of a reconciliation session: get data in, match it, then export.
Finding everything: the sidebar tour
The menu down the left-hand side is how you move around the app. Above the links sit your business and quarter selectors. The links themselves take you to each part of your bookkeeping:
- Dashboard — the home screen you are reading about now.
- Transactions — your bank transactions for the quarter, showing money in and money out and whether each one is matched.
- Receipts — purchase receipts and invoices you have uploaded or synced, with the supplier, amounts and BTW the app has read for you.
- Matching — the reconcile screen where you review and approve the links between transactions and receipts.
- Mileage — log business trips at the €0.23/km rate and keep your mileage log for the quarter.
- Discrepancies — anything that does not line up cleanly, such as an invoice with no payment or an amount that does not match.
- Reimbursements — expenses paid from a personal account and the balance your company owes back.
- Export — download the accountant-ready spreadsheet for the quarter.
- Bank Connections — connect a bank for automatic transactions, or check and refresh an existing connection.
- Settings — your language, country, accounting connection and other preferences.
A good way to work is top to bottom: bring transactions and receipts in, run matching, clear any discrepancies, check mileage and reimbursements, then export. The dashboard simply gives you a running summary of how far through that flow you are.